
Imagine that you are working for a company and would like to increase your product sales in a specific region of the world. For that purpose, you have hired a sales force – a bunch of salespeople – to target customers all over the region, e.g., by face-to-face visits or phone calls with specific content about the product (e.g., for a pharmaceutical drug, it could be the benefits of using it for their patients compared to the competitor products).
But what now? There might be thousands of customers in the region, and it will be very expensive and impractical to target all customers, and they might not even respond positively to being targeted. What a waste of money!
A better approach is to use A/B testing. You simply target a limited amount of the customers chosen randomly – e.g. 100 – 1000 – and see if you get a higher average uplift in product sales for those customers compared with the untargeted ones. If the uplift in product sales is very small the targeting approach might not be worth the effort, or you have to reconsider which content you are delivering to the customers. Maybe different content should even be prepared for different kinds of customers? The good thing is — you only wasted your efforts on a limited number of customers and saved a lot of money!
But what if I told you that the A/B testing can do much more than that? By utilizing Machine Learning techniques, the algorithms can actually learn from your A/B testing what kind of customers to target and what kind of customers not to target with the prepared content. The Machine Learning algorithm simply looks for patterns in your A/B testing experiment and identifies characteristics for customers that respond well to being targeted — it could, e.g. be customers with specific age, location, specialization, responsibilities and so on. In this way, the algorithm can tell you exactly what customers to target to optimize your product sales when you go live with a full marketing campaign and, at the same time minimizing your marketing spends by not targeting the non-responders.
This approach can be applied to a wide variety of marketing situations, as long as it involves customer acquisition, development and retention. In this article, we will explore how to make your marketing strategy more impactful by combining these two separate but powerful techniques – A/B Testing and Machine Learning – to do what is called Uplift Modelling. This first part will focus on A/B testing, and the second part will dive into utilizing machine learning techniques.
Effects of Marketing
To start with we identify four types of customers when it comes to the effects of a marketing approach, introduced by Kane et al. (2014):
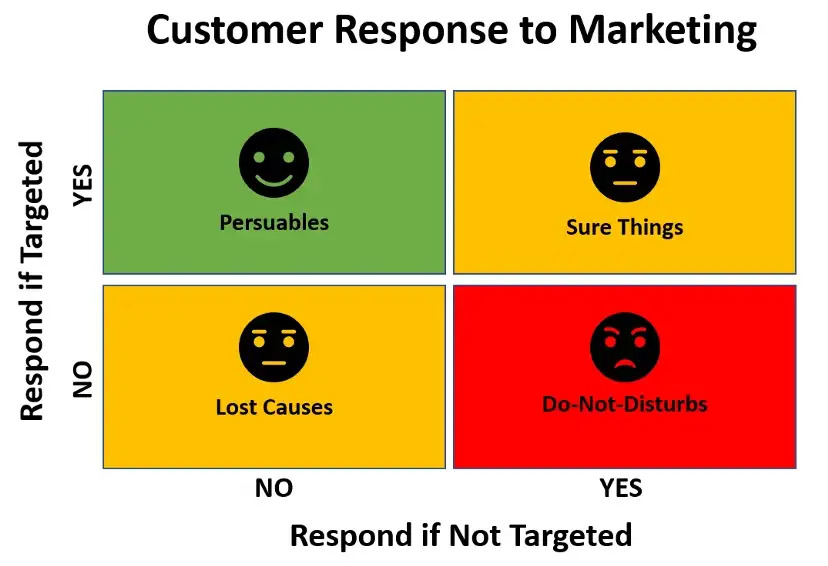
- Sure Things: These customers will respond no matter if they are targeted with marketing or not. There is, however, still a cost associated with targeting them.
- Lost Causes: These customers will not respond no matter if they are targeted with marketing or not. They are simply a “Lost Cause”, and no extra value comes from targeting them.
- Do-Not-Disturbs: These customers will respond negatively to being targeted. There is not only a cost associated with targeting them but also a negative impact on product sales. This can be a result of the marketing content not being received well by this specific customer group or simply that they are getting annoyed by constant marketing from your company.
- Persuadables: These customers will respond positively to being targeted compared to when they are not targeted, and should therefore be the focus of the marketing campaign.
It is important to add that even though a customer might be, e.g., a “Lost Cause” through one marketing channel or to a specific content about your product, they can still be a “Persuadables” through another channel or content. An optimal marketing strategy will market the products to the customers in exactly the way that influences them the most!
The trick of any uplift model is to identify the “Persuadables” for a specific marketing channel and specific content about your product, as it is the only group with a real positive impact on product sales.
It is also very beneficial if the Do-Not-Disturbs are identified as well, as you definitely do not want to disturb this group of customers.
How to Do A/B Testing
A/B testing is commonly carried out in, e.g., webpage design or software development. The goal could be to compare two different webpage designs – A and B – on a subset of the users to see which one is generating the most sales/click-through rates and eventually should be implemented for all users. It is a fast, low-cost method of choosing the right design before implementing it for all customers.
In the same way, the purpose of A/B testing in marketing is to investigate the impact of a marketing strategy by first testing it out on a small subset of the customer base (e.g., 100 – 1000 customers, called the development base). In this way, we get a good idea of the impact of the marketing strategy if it is being carried out on the whole customer base. The primary purpose is obviously to investigate if the marketing campaign will be a success before doing a full and often very expensive marketing campaign on a massive number of customers.
It is essential that customers in the development base are representative for the customers in the customer base to confidently make any conclusions about the customer base from the A/B test results in the development base. A total random subset of the customer base is the best choice for a development base and gives the best model, but if it is not feasible, we should try to get as close to this as possible. Alternatively, the development base can be drawn randomly from a subset of the customer base – with specific characteristics – but the results can, in that case, only be carried over to customers with similar characteristics in the customer base. This is useful if you are only interested in targeting, e.g., customers with specific age, jobs, life situation, subscriptions etc.
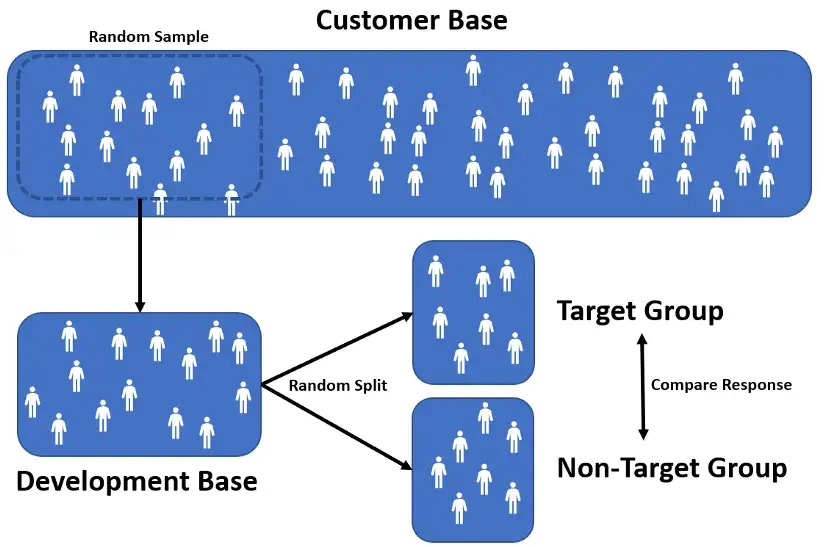
The development base is then randomly split into two groups – one where the marketing campaign is carried out (“targeted” or “A”) and one where it is not (“not-targeted” or “B”), as illustrated in the figure above.
The goal is to give an objective measure of the difference in sales/response rates for similar customers if they are being targeted with marketing or not, called the true uplift.
This purpose is to identify “Persuadables” – as “Sure Things”, “Lost Causes”, and “Do-Not-Disturbs” do not add additional product sales when being targeted, but there is still a cost associated with the targeting as marketing is definitely not free.
The main practical issue with setting up an experimental design for A/B testing in marketing is to convince management of the switch in strategy. A significant investment is required to start testing out different strategies on real customers without a guarantee of immediate increased product sales, as harvesting the benefits of an experimental A/B procedure normally takes time. Furthermore, you are dependent on having sufficient data about the customers to enrich the model and, of course, data of high and reliable quality. The data is the foundation of any successful model, after all. The potential benefits for your marketing department can, however, be a real game changer with an efficient setup for A/B testing!
The Simple Approach: Is the Marketing Successful?
The simple approach of uplift modelling is simply to define the “true uplift” as a result of the targeting as the difference in uplift for the target and non-target group in the A/B test:
TRUE UPLIFT = UPLIFT(TARGET GROUP) -UPLIFT(NON-TARGET GROUP)
That’s it! Easy and simple! It gives you a direct measure of what you can expect if the marketing efforts are carried out for your whole customer base, and this is the true power of A/B testing.
By using A/B testing, you can potentially avoid spending a huge amount of money on an unsuccessful marketing approach for your whole customer base.
Again, the trick is to pick the target and non-target group completely randomly for a truly objective result. There also must be enough customers in the A/B test for the results to be statistically significant. A simple comparison of the uplift distributions in the two individual A/B test groups can help answer that question, as illustrated below.
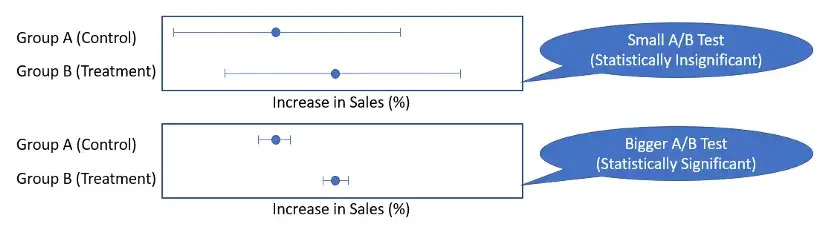
Established statistical frameworks exist for estimating the necessary number of customers in an A/B test to measure an X percentage difference between the two groups. In general, you need more customers for higher variance in your target variable (e.g. in sales for each customer) and if you are looking for minor differences in sales uplift between the two groups. It is important to monitor the A/B testing results during the A/B test to ensure that protocols are being followed and that the results are statistically significant (no need to continue an A/B test if there are no statistically significant difference between the “A” and “B” group).
This simple approach can be extended by defining different groups and comparing the “true uplift” between the groups – e.g., customers older/younger than 40 years old, customers in the city vs the countryside and so on. The more groups you define, the bigger your A/B testing group must be for your experiment to be statistically significant!
This subgroup approach hints towards which type of customers the marketing efforts can most effectively be spent – and this is actually one of the simplest forms of uplift modelling – identifying subgroups of customers that are more effective to target. We will get back to that later, where we generalize the approach and make it more powerful using Machine Learning to identify features defining good target customers.
Instead of defining the subgroups “by hand”, we can also take advantage of machine learning-based clustering algorithms, such as, e.g. k-means, to identify clusters of customers with similarities. In this way, we might be able to see specific clusters with bigger uplift and clusters with smaller uplift because of being targeted. Customer segmentation is a very interesting analysis tool for optimizing your marketing strategies, your A/B testing and understanding your customers. It’s outside the scope of this article but might be the focus of an upcoming article.
The Machine Learning Approach for Uplift Modelling: Which Customers Should Be Targeted?
It is important to note that a good uplift model, tries to estimate the “increase in probability of responding” of a customer being targeting instead of “the probability of responding”.
Specific analytical tools are needed to find and predict the change in customer behaviour as a result of being targeting as the same customers can not be both targeted and non-targeted — and therefore you can not directly compare the results for specific customers. You therefore rely on the overall similarity of customers in your target and non-target groups in a statistical sense. There are several different ways of modelling this with Machine Learning approaches.
- The Two-Model Method
- Lo’s and Lai’s Methods
- Advanced Tree- and Ensemble based Methods
The goal is to be able to predict the true uplift for customers when targeted based on their characteristics such as age, purchase history, location etc. so you can rank your customers from most to least profitable when it comes to selecting marketing targets.
The best approach normally varies from use case to use case, so it is often necessary to experiment with several different approaches and pick the best one. In general, the advanced tree/ensemble methods have shown to be slightly more accurate — but also more difficult to implement — however it is not always the case.
Two-Model Approach
The two-model approach is also called the “naïve” approach. You simply build two machine learning models and combine them to predict the true targeting uplift. Any supervised model can be used – one for estimating the response rate / sales uplift for the targeted group (Mₜ) (using only the targeted customers) and one for the untargeted group (Mₙₜ) (using only the non-targeted customers). You then use the customer characteristics (e.g., location, age, purchase history, profession etc.) as model features and the A/B test results for response rate / sales uplift as target values and just like that you have two different models. The prediction of the “true uplift” (U) for a specific customer cₓ is then the difference between the two prediction results for that customer:
U = Mₜ(cₓ) -Mₙₜ(cₓ)
This is in fact the uplift prediction in the model for targeted customers minus the uplift prediction in the model for non-targeted customers. The benefit of this approach is the simplicity but it also comes with several drawbacks. First each of the models only consider data for their specific subgroup of the data (target and non-target customers). This means that the models are optimized for estimating response rates for two separate groups of customers individually and they are not built directly with the purpose of estimating true uplift. Secondly, both models need to be very accurate as the errors and uncertainties in the models are amplified by taking the difference in the prediction results.
A more robust and consistent way of doing uplift modelling would be to build a single machine learning model with the purpose of predicting the true uplift directly — using a combined dataset of both targeted and non-targeted customers.
Lo’s and Lai’s Methods
As mentioned in the previous section, it would be beneficial to define one single machine learning model build directly for predicting true uplift using the full dataset of both targeted and non-targeted customers. This section will introduce two different approaches to this problem – Lo´s and Lai´s methods (Lo et al. (2002) and Lai et al. (2006)).
Lo´s Method:
This method takes a very direct approach to estimating the uplift by using machine learning and the introduction of a dummy variable (t) which indicates if the customer is in the treatment (1) or control group (0) – in addition to the standard customer features to predict if customer responded (y=1) or not (y=0) as illustrated in the table below.
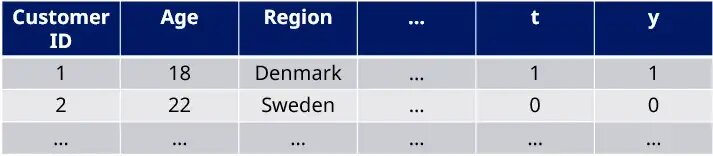
The method was originally developed to be used with logistic regression but can be generalized to any supervised learning algorithm. This model allows for a straight-forward calculation of the “true uplift” (U) for a customer as the difference in predicted response probability (or sales uplift) for t=1 and t=0 using the same machine learning model (M):
U = M(t=1) -M(t=0)
This gives you a direct measure of which customers have the highest predicted values for “true uplift”. It should be strongly considered to target the customer with the highest predicted values and not target the customers with the lowest values unless there are good reasons to do otherwise. This prioritization of customers has the potential to boost your sales without increasing the spend on marketing efforts by focusing the efforts on the most promising customers.
In some cases, the treatment variable (t) is not being picked up by the machine learning algorithm and it can be due to two very different reason 1) it is truly not significant and your marketing efforts are not bringing any value, 2) its highly correlated with other parameters in your model. In the second case you might want to exclude some of those highly correlated parameters.
In Lo´s approach an additional set of features x*t are sometimes included in the model as well. It is simply all your normal features multiplied by t (which can be 0 or 1 depending on if the customer is being “treated” or not). This allows for the model to more directly pick out effects related to the uplift of treated customers.
Lai´s Method:
This method ties back to the four different types of customers defined in the beginning of this article – “Sure Things”, “Lost Causes”, “Persuadables” and “Do-Not-Disturbs” – with the aim of identifying “Persuadables” as this is the only group of customers benefiting from the marketing efforts.
The approach for doing that is first to split the customers into four different groups (g) based on what was actually observed in the A/B test:
- Control Responders (CR): Non-target customers responding
- Control Non-Responders (CN): Non-target customers not responding
- Treatment Responders (TR): Target customers responding
- Treatment Non-Responders (TN): Target customers not responding
The standard Lai’s approach is to define TR and CN as good targets (y’ = 1) because these two groups together contain all “Persuadables” and do not contain any “Do-Not-Disturbs”. In the same way TN and CT are defined as bad targets (y’ = 0) as illustrated in the table below.
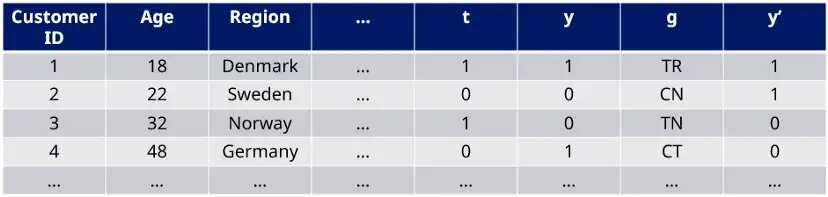
The problem has then been reduced to creating a binary classifier (M) to predict good or bad marketing targets. Alternatively, you can use a machine learning algorithms (M) to directly estimate probabilities for each of the four groups – TR, CN, TN, and CT. The uplift score (U) can then be defined as:
U = M(TR) + M(CN) -M(TN)-M(CR) = M(good) -M(bad)
These methods are more complicated to implement if your target variable (y) is continuous as you have to define a threshold for positive response (corresponding to y=1) and non-response (corresponding to y=0). The approach is also not optimal in the sense that it does not exclude “Lost Causes” and “Sure things” from the good target variable.
If the size of the control and treatment groups are different, you should instead investigate the generalized Lai’s approach as introduced by Kane et al. (2014).
Advanced Tree- and Ensemble-based Methods
There is a whole family of tree- and ensemble-based methods designed to tackle this problem as well. A deep dive into this field is outside the scope of this article but might be addressed in another article in the future. Some examples are significance-based uplift trees (Radcliffe and Surry (2011), Hansotia and Rukstales (2002), Chickering and Heckerman (2000)), divergence-based uplift trees (Rzepakowski and Jaroszewicz (2012), Soltys and Rzepakowski (2015)), uplift random forests (Guelsman et al. (2012), Guelsman et al. (2014) and uplift bagging (Soltys et al. (2015)). Many of the advanced algorithms have been implemented in R (e.g., check out CRAN – Package tools4uplift (r-project.org) from Belbahri et al. (2019)).
Evaluation of the Uplift Models
In this section, we will go through different ways to evaluate and visualize the results of the uplift model.
Uplift by Decile Graph
The uplift by decile graph is a popular visualization to get an idea about the quality of your uplift model. All the observations/customers in both the treatment and control group are combined, scored with the uplift model and then ranked from high to low predicted uplift in deciles. The next step is to calculate the average actual increased sales/response rate in the A/B test for both the treatment and control group in each of the deciles. A good uplift result is if the actual measured increase in the treatment group is higher than in the control group as this means that the marketing campaign is working. A good model result is to have a bigger difference between actual increase in sales/response rates for treatment and control group (true uplift) in the left part of the bottom figure below, as these deciles have the best target customers for treatment according to the model and therefore should experience the highest increase compared to not being targeted. As there might be “Do-Not-Disturbs” among your customers you can get negative true uplift values for the low scoring customers. The figure below illustrates a promising uplift model.
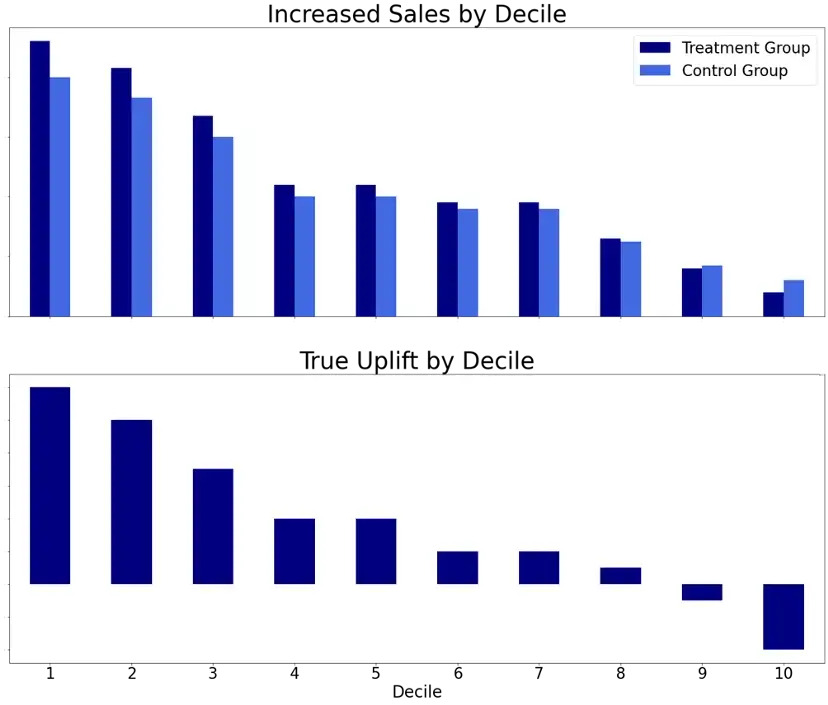
It should be noted, that for many use cases the ranking of customers is much more important than the actual uplift values predicted by the model.
Qini Curve
The Qini curve is constructed by first sorting the customers from highest to lowest predicted uplift from the uplift model (as in the top figure below). Then the accumulated uplift (lower figure below) is calculated simulating the actual sales uplift if you start your marketing strategy by starting with the most promising customers and ending with the least promising customers at 100 % of customers reached. The results can easily be compared to a baseline of random selection of target customers where you do not start by targeting the most promising customers. If the cost of targeting customers with the marketing is known, a cut-off can easily be defined for “good targets” where the sales uplift of the customers is higher than the marketing costs as also illustrated below:
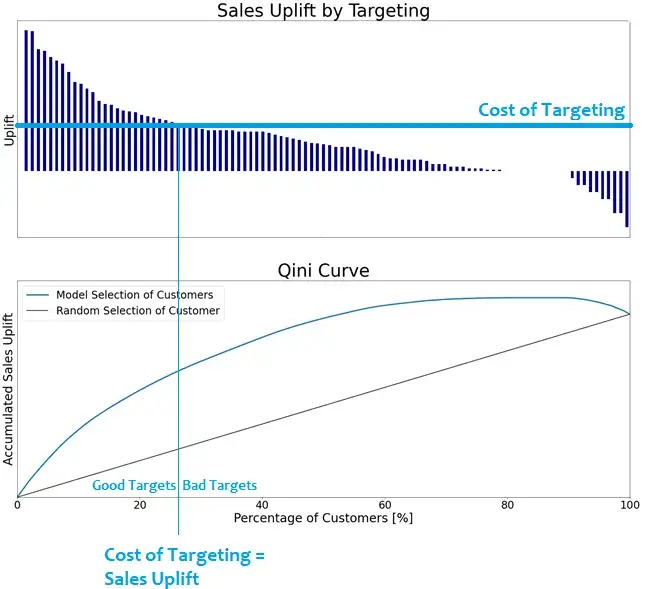
The Qini curve gives you a good picture of the additional sales you can achieve by selecting target customers using the uplift model compared to a random selection of target customers. The baseline can also be redefined as the accumulated sales uplift from the existing targeting strategy. The Qini curve also tells you how many customers it makes sense to target before your marketing expenses will be higher than your increase in sales, e.g., around 25 % of the customers in the figure above.
The Qini curve can also be used to calculate the “Qini measure” which is a model performance metric calculated by the area between the Qini curve and the baseline. It tells you how much better you can do by targeting your customers according to your uplift model than by targeting your customer randomly or using the existing marketing strategy in your team.
A/B Testing
The most robust and straight-forward method to validate your uplift modelling results is simply to do another A/B test on your customers. Let group “A” be customers where you use your current targeting strategy or random targeting (depending on what is your baseline) and group “B” be customers where the suggested targeting strategy from the uplift model is being used – and compare the results. This is of course more time consuming and will include an additional cost but there are many benefits to this approach. If the A/B test is a success it is one of the strongest possible arguments that the model results can be trusted and is definitively a breaking argument with a stubborn stake holder not believing in the models. It is simply hard to argue with a well performed A/B testing experiment if the target/non-target split is truly random of course!
A/B testing is the most trustworthy method to compare your existing marketing strategy with the strategy suggested by the uplift models.
What if You Already Have an Effective Marketing Strategy?
If you already have an effective marketing strategy for targeting your customers, it is possible to construct your A/B testing in a slightly different way. Again, we randomly split the customers into group “A” and “B” with customers in group “A” not being targeted by the marketing. For group “B” you can then use your existing marketing strategy as usual and calculate the true uplift after the A/B testing. This will give you a direct estimate of the actual sales uplift from your targeting and by applying the same Machine Learning approaches on top, the algorithms can learn how to further improve your existing marketing strategy. It will simply suggest corrections to your already effective marketing strategy to make it even more effective.
Conclusions
This article explained how to utilize A/B testing and Machine Learning techniques to optimize your marketing strategies to increase sales without wasting valuable marketing resources on the wrong customers. It identified one segment of customers -“Persuadables”- benefiting from your marketing efforts and three segments not brining any value. Using A/B testing is a powerful technique to assess if a marketing campaign will be a success without doing a full investment on your full (potential) customer base. Machine Learning added on top will learn from your A/B test which kind of customers have the highest sales uplift when targeted and can be used to rank and prioritize your customers from most to least promising marketing targets. This will help you spending your marketing resources on the right customers and boost your sales numbers.
The downside of A/B testing, and uplift modelling is that a relatively elaborate experimental design needs to be established to gather the required data and validate performance. Is it worth it? You decide.
About the Author
Peter Vester is a Lead Data Scientist at the AI & Analytics Centre of Excellence in Novo Nordisk working with a variety of data science projects all over the organization e.g., in research, marketing, production lines, finance forecasting and the supply chain. Passionate about bringing value from data by utilizing Advanced Analytics and Machine Learning solutions in production. Enjoy working in the cloud and using infrastructure-as-code solutions for creating Machine Learning infrastructure solutions that can easily be changed, reused, and modified towards different business needs. Has a solid background as a full-stack data scientist, from deep technical understanding to data statistics and machine learning as well as excellent storytelling and presentation skills. Graduated with a PhD in Physics/Data Science from DTU in 2018 and have been working at CERN and with data science projects in finance before joining the healthcare industry.
Featured image credits: Prostock-studio on Envato Elements
The views and opinions expressed by the author do not necessarily state or reflect the views or positions of Hyperight.com or any entities they represent.
Similar content: