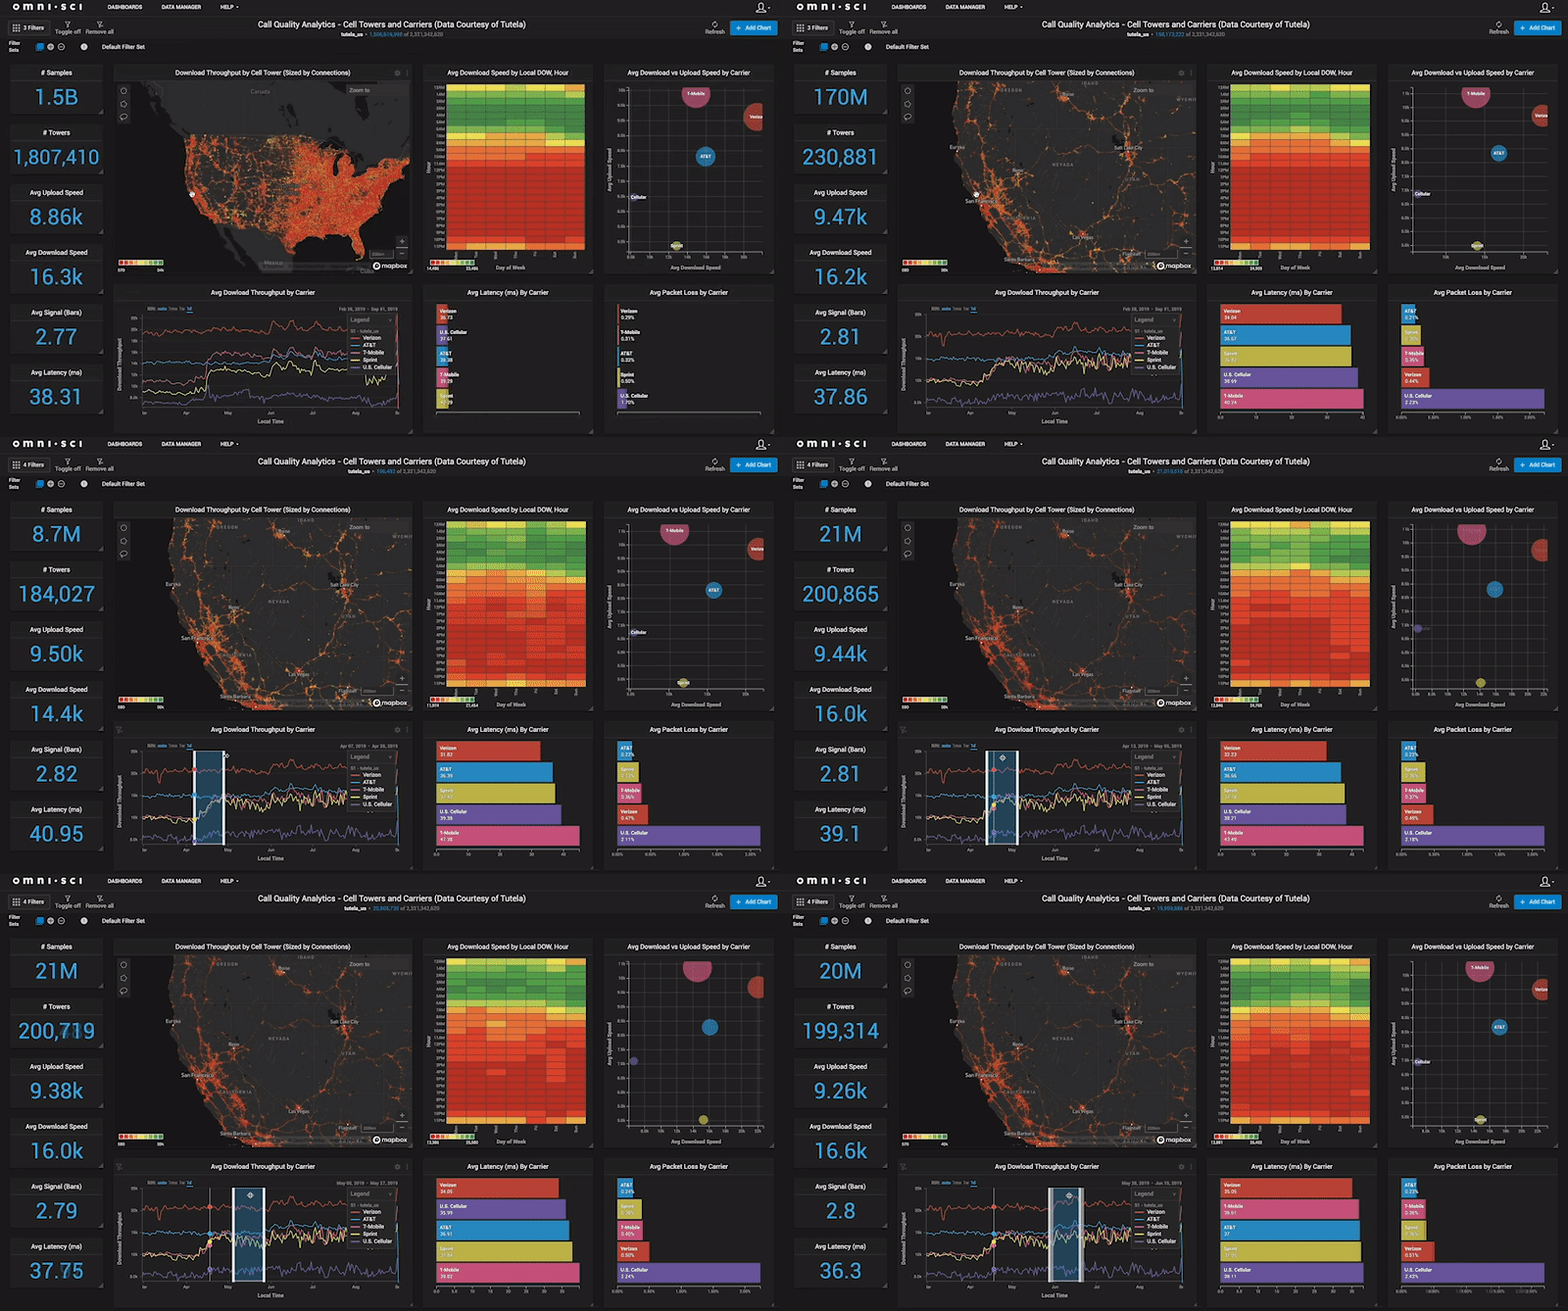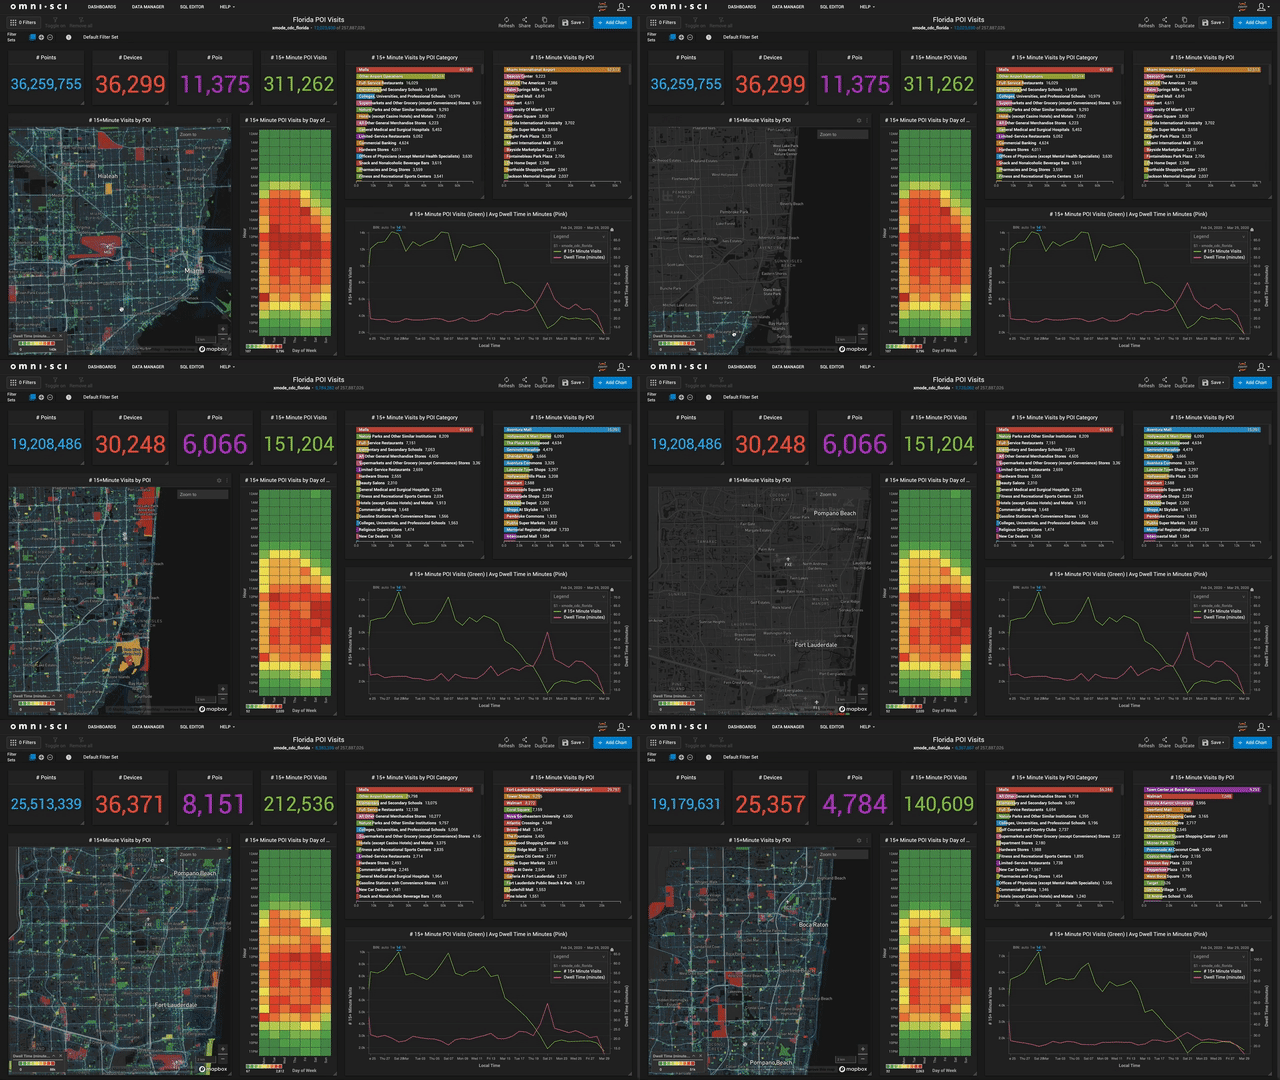

The mainstream self-serving analytics tools are designed to provide analytics, dashboards and visualization capabilities to all people in the organization, even line workers that may not have had experience with analytics before. However, these mainstream analytics tools often rely on underlying processing technologies which require complex, expensive system architectures and data pipelines to support them. Additionally, with most traditional analytics solutions, the process of getting answers and insights is slow, cumbersome, and siloed, where only the start of a typical analytics project life cycle may last days in data preparation, indexing, analysis, data modelling. Alternatively, accelerated analytics relies on fundamental capabilities, around handling big data using GPUs and CPUs.
For this reason, we invited no other than Todd Mostak, the pioneer in building GPU-tuned analytics and visualization applications for the enterprise. Todd Mostak is the CEO and Co-Founder of OmniSci, our Data Innovation Summit 2020 partner and the pioneer in accelerated analytics, redefining speed and scale in big data querying and visualization. Todd talked to us about how the idea of a GPUs-accelerated analytics platform originated during his graduate research at Harvard on the role of social media in the Arab Spring.
Hyperight: Hello Todd, we are excited to have you and OmniSci as our partners at the Data Innovation Summit 2020. Before we continue with further questions, please tell us a bit more about yourself and OmniSci.


Todd Mostak: Hi, and thanks for having me! I’m the Founder and CEO of OmniSci (formerly MapD). I started the company 6 years ago, building on research I was conducting at MIT CSAIL on leveraging the parallelism of GPUs to accelerate SQL and visualization on big datasets.
Fast forward to today, and we’ve been fortunate enough to receive 4 rounds of investment from GV, In-Q-Tel, NEA, Nvidia, Tiger Global, Vanedge Capital, and Verizon Ventures, as well as work with Global 2000 customers in verticals ranging from telco, automotive, oil and gas, retail and CPG, insurance, and manufacturing, in addition to a rapidly growing list of public sector organizations.
Hyperight: Todd, you are the pioneer in building GPU-tuned analytics and visualization applications for the enterprise. Could you please tell us more about how you got the idea of using GPUs to accelerate the extraction of insights from large datasets?
Todd Mostak: OmniSci has a bit of an unorthodox origin story. After finishing my undergraduate studies in 2006, I wanted to see the world and by chance found a job teaching English in Aleppo, Syria. I didn’t know Arabic at the time, but fell in love with the culture and language and ended up spending a few years in Syria and Egypt teaching English, studying Arabic, and eventually working as an Arabic translator in Cairo. Almost immediately after I returned to the US for grad school in Middle Eastern Studies at Harvard in 2010, the Arab Spring erupted. Like many others, I was struck by the role that social media, and particularly Twitter, was playing as a catalyst for the uprisings, but I also immediately saw it as an unprecedented source of data on what people who were participating or affected by these movements were saying, and when and where they were saying it.
Inspired by the possibilities, I soon was tapping into the Twitter API and harvesting hundreds of millions of geocoded tweets from Egypt. That part was fairly easy, but I was in for a bit of a rude awakening when I started to try to make sense of the data. The actual scripting and analysis itself were not so hard, as I had taken a few programming courses and was familiar with the basics of statistics and data analysis. Rather, the barriers I encountered were related to getting timely answers to the many burning questions I had of the data. The SQL queries, visualizations, and geospatial, NLP, and graph workflows I was attempting to run over the data would often take hours, if not days, and that was if my system did not run out of memory first. My frustration drove me to delve into potential ways to accelerate my workflows, and I quickly redirected my elective credits to whatever computer science courses they’d let me into, which was not a lot given my concentration was nowhere close to computer science. One course I could get entry to was a GPUs graphics course, likely because GPUs, in general, weren’t considered particularly cool or interesting (in 2011 we were still years ahead of the GPU-accelerated deep learning revolution that would bring massive hype to the world of GPU computing). Serendipitously, I had just bought an Nvidia graphics card, to be honest partly to indulge a gaming itch, and I became increasingly interested in how the thousands of cores of even a modest consumer graphics card could be harnessed to accelerate the analytics, visualization, and data science workflows that were central to my research.


Finally, in Spring of 2012, my last semester at Harvard, I was fortunate enough to be able to cross-enroll in the MIT database course, taught by the legendary Mike Stonebraker (recent recipient of the Turing award), and Sam Madden, both co-founders of hot analytics database startup Vertica. I quickly was drawn to the burgeoning research and commercialization of analytically-oriented column-store databases (like Vertica), and began to think of how the massive parallelism of GPUs could be used to accelerate such an architecture. Soon enough, I was building a prototype of such a system for my final project. After countless sleepless nights, I submitted to Mike and Sam a barebones alpha of “Massively Parallel Database” (MapD). It was primitive in almost every way, but it could run simple analytic SQL queries over billions of records with latency measured in milliseconds, without downsampling, pre-aggregation, or indexing. Furthermore, it had the ability to not only query data quickly, but use the GPUs for what they were originally designed for and render the results in-place without copying the data of the GPU, which was particularly well-suited for visualizing massive amounts of geospatial data, something that would prove to be an early differentiator of our platform.


Mike and Sam were intrigued enough to offer me a position as a research fellow at MIT CSAIL in the database group, which was quite a leap from Middle Eastern Studies! I spent a year there fleshing out how various analytics workflows could be accelerated with GPUs and building on my initial prototype work. In the process, I had the opportunity to demo my work on several occasions to various commercial and federal partners, and found that despite the spartan feature set of the system at that point, they immediately craved the ability to slice and dice their data at the speed of thought, after seeing the system enable cross-filtering of a billion tweets at interactive frame rates. It was then that I recognized that the problem I had was not just my own, but was shared by a large swath of analysts, data scientists, and decision-makers who were enchanted by the promise of big data analytics, but struggling to find ways to easily and quickly get insights using conventional solutions. That realization is what drove me to leave MIT and try to commercialize what had until then been a passion project.
Hyperight: OmniSci harnesses the transformative technology of GPUs for data processing, big data querying and visualization. What are the benefits of it compared to traditional hardware and software?
Todd Mostak: At a technical level, OmniSci is synonymous with speed, manifested in the ability to query and visualize billions of records of data in milliseconds, without pre-prep of the data. I should note that while part of that is due to the parallelism of GPUs, much can also be attributed to the various optimizations we’ve put in place to take advantage of the performance of modern hardware (which also includes CPUs).
However, at the end of the day the value is not in the orders-of-magnitude speedups you can often see with OmniSci, but in how those performance gains translate into business value by enabling data practitioners and decision-makers to get deeper insights from their data in significantly shorter time frames. Note that deeper and faster here are intimately related. As was the case with my graduate research, getting to deeper insights is often a cyclical path of refining both questions and hypotheses, a cycle of ask, hypothesize, and iterate. A slow analytics solution both prevents you from asking as many questions and from diving as deep in a question, as you would with a platform that allows you to work at the speed of your curiosity. This is not an abstract thing. We’ve seen a major US telecommunications provider gain the ability with OmniSci to drill down to the source of network errors in minutes, rather than the hours or days it previously took, a gaming company able to significantly improve the stickiness of their games by sifting through massive amounts of telemetry data, and the cable provider Charter save tens of millions of dollars and provide better customer service by using OmniSci to optimize the placement of wifi access points.
There’s another aspect though that is not just about speed. We often use the term “converged” to talk about the new vistas opened by a unified view of the data. Today, in a given organization, you might have a data engineering group querying and munging a dataset in SQL, an analytics group using a BI tool like Tableau to visualize the data, a data science group building and refining models in a notebook environment, and a few GIS experts using ESRI for spatial analysis of the data. With OmniSci, aided by the unique ability of GPUs to enable both fast compute and visualization over massive amounts of data, these various personas get a unified view of the data, while still being able to power their core workflows via standard database connectivity and deep integration with the PyData ecosystem. To put it another way, our customers find that with the converged analytics capabilities of our system, they become less siloed and get a more holistic view of the business problems at hand.


Hyperight: How can companies make data science and analytics accessible and understandable to everyone in the organization?
Todd Mostak: A major barrier to the widespread adoption of the power of analytics and data science within organizations is the fact that with most traditional solutions, the process of getting answers and insights is slow, cumbersome, and siloed. A typical analytics project life cycle might first involve spending hours or days trying to figure out to load the data, or worse, waiting for weeks for IT to respond to a ticket to do the same, then roughly repeating the process to figure out how to massage, index, pre-aggregate, or down-sample the data to make analysis tolerably performant, then struggling further untold hours with slow analysis, which not only includes the time to query, visualize, and model the data, but also potentially bouncing between multiple products (and perhaps people) to get the full picture of what is happening. In this depressing reality, analytics projects will be seen as a massive chore at best, and potentially a waste of time, as by the time the beleaguered practitioner navigates the aforementioned labyrinth, the question at hand may no longer be relevant to the business. Even though an organization may be pouring a significant amount of money into hiring the best analysts and data scientists on the market, and untold time training them, it can be for naught if the right analytics infrastructure and tooling are not in place.


Contrast that with a world in which analytics is instant, effortless, and powerful. Getting answers in a timely fashion, and being able to explore your data at the speed of curiosity not only leads to clear ROI and makes stakeholders happy, but it frankly is addictive. One of our customers said that after struggling for years trying to make traditional BI tools scale and work with their data, the ease with which OmniSci allowed them to ask questions of and get quick answers from their data not only made them significantly more productive, but made their jobs more enjoyable in the process. Such engagement creates a virtuous cycle, where both decision-makers and practitioners become more confident of their ability to get value from data, and the whole organization becomes more data-driven, and with that gains a competitive edge.
Hyperight: How does the COVID-19 impact the demand for data science and analytics tools?
Todd Mostak: Covid-19 is a classic black swan event, not only in that most people did not predict it, but in that it has upended all of our models and assumptions about normal human behavior. Whether commute, buying, travel, or communication patterns, we’re finding that all the carefully cobbled together models that had high predictive power in 2019 are practically worthless in 2020. To adapt, organizations have to be more agile than ever before, whether insurers being pushed to quickly adjust risk models and premiums for drivers, retailers having to navigate fast-changing supply chains and consumer demand profiles, communication providers struggling to meet surging demand for bandwidth on residential networks, or manufacturers striving to keep both their employees safe and their workplaces open in the face of the ongoing outbreak. They need to be able to rapidly query, visualize, and geographically analyze data to understand an unprecedented dynamic and volatile operating environment, where the old batch analytic processes that take days or weeks to deliver outdated-on-arrival answers can mean making the wrong decision, or perhaps just as dangerous, a decision too late. As such, we’ve seen a surge in demand for accelerated analytics solutions, as it’s literally become a matter of survival.
Hyperight: And lastly, what is the role and potential of data science and analytics in understanding and keeping track of COVID-19?
Todd Mostak: Analytics and data science are playing a core role in understanding, tracking, and helping to slow the spread of COVID-19. Whether building models from a wide variety of datasets on the drivers of disease spread, enabling contract tracing and hotspot identification, or predicting the impact of various policy decisions, such as school reopenings, lives are being saved and economies kept open via the adroit application of data. We’ve found that the massive scale and often geospatial nature of much of this data has lent itself well to the OmniSci platform, and have been honored to leverage our solution to assist in the fight against the virus.


Add comment