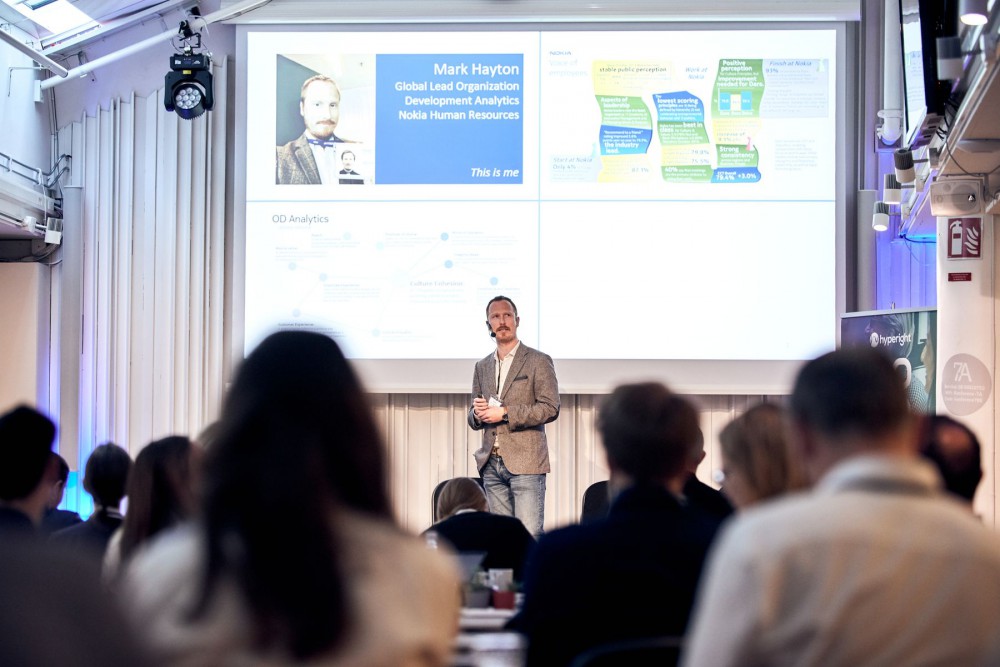
What happens when a company grows so rapidly and its employee base increases three-fold? If you don’t do it right, “the culture will eat your strategy for breakfast,” according to Mark Hayton, responsible for HR analytics and employee surveys at Nokia.
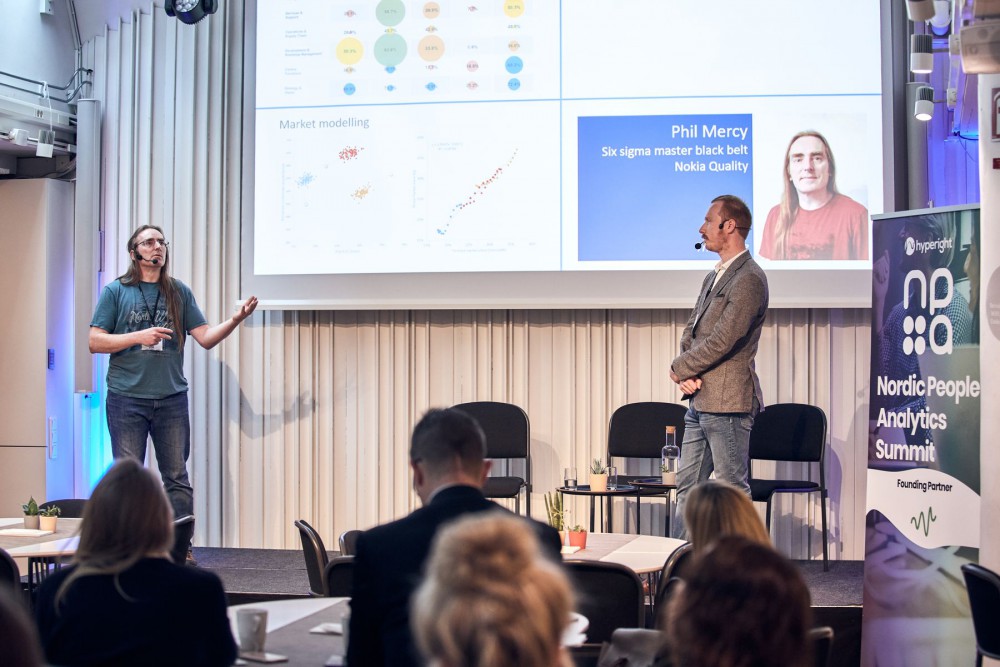
Nokia’s journey in the past 5 years has been a turbulent one, to say the least. In their presentation at the last Nordic People Analytics Summit, Mark Hayton and Phil Mercy introduced us to the expansion process that a technology company such as Nokia goes through while rebuilding their HR and people analytics strategy to achieve analytics-driven cultural cohesion.
But what were the reasons that caused such a disruption in their company? What follows is a breakdown of the individual causes that brought Nokia to where it is today.
When you expand your employee base, if you don’t get it right, the culture will eat your strategy for breakfast. — Mark Hayton, Nokia
3 conditions that caused disruption in Nokia (a.k.a How they used people analytics to improve employee satisfaction and engagement)
1) The first condition was the transformation of the company in its very core. Mark explains that they sold mobile phones, handsets and services to Microsoft and they bought Alcatel Lucent. In the course of one year, Nokia transformed its core services from producing mobile phones to infrastructure and networks, and as a result, grew its employee base from 35,000 people to 100,000 people.
2) The second disruptor was theoretical challenges with terms like employee engagement, commitment, loyalty, promoters. The theoretical methods they used to measure them were not applicable to the new work environment.
To gather employee feedback, Nokia used a Net Promoter Score – a tool that measures how much employees would promote and recommend a certain company as a good workplace, and asked the simple question: “If you are a promoter, how would you promote us?” What they wanted to find out is what are the circumstances under which an employee would recommend the company. They discovered that whether an employee is a promoter depends on a lot of factors such as the job position, the personal situation, but also on the personality of the employees. Mark’s team came to the conclusion that the theoretical answers of the net promoter score only had a nominal correlation with employees and weren’t relevant.
The second theoretical challenge they had was with discretionary performance, or employee engagement, referring to whether employees are going the extra mile and giving their 110%. But what they learnt was that the definition of discretionary effort was no longer applicable because the modern work environment had changed so much with the flexible working time, autonomous and agile teams. The boundary between what an employee was “told to do” and what they “want to do” was blurred.
The employee survey they used for engagement contained disparate categories such as health and safety on one hand, and salary and career opportunities on the other. And as a consequence, they got an unrealistic engagement index which they couldn’t add up to their qualitative research.
3) The third challenge they experienced was with the rigidity of the census survey. Nokia used a survey vendor that did their employee surveys. But from the moment they had an idea of the questions until the moment the management had any insight to make a plan it took 9 months. In terms of GDPR and data security, the vendor didn’t give them the confidence they needed. When they wanted to integrate the data in a statistical model, it took a long time to get the data and on top of all it was incomplete and didn’t match the reports they were provided.
It had become obvious that Nokia needed to take matters into their own hands. They parted ways with the vendor and supplied themselves with a survey tool, a data modelling tool and a data visualisation tool. Mark and his team started doing, analysing and visualising surveys, which resulted in the lead time to get insights from 9 to 1 month. At the time of his presentation, their survey process was optimised to 3 days including closing the survey, wrapping up the database and loading the visualisation tools with models and statistical analysis.

Having the appropriate tools enabled Nokia to unlock new opportunities with their surveys and analytics: they could now stratify samples, customise questions for different people, find the right questions and answers for the right department and visualise and share the results. The next step they want to enable is sharing the results with all employees.
By taking the vendor out of the process and building tools for every process part, Nokia was able to own their survey process. And this, Mark emphasises, is critical for the transformation of a survey team into a proper analytics department. The transformation includes important changes such as the way data is gathered, processed, modelled, analysed, visualised.
By taking the vendor out of the process and building tools for every process part, Nokia was able to own their survey process.

How they used analytics to compare the customer experience and employee satisfaction and achieve cultural cohesion
Nokia experiences a similar type of crisis with customer experience analytics, says Phil Mercy, Six Sigma master black belt at Nokia. Parallelly to employee surveys, they were also working on developing a new approach to customer experience metrics and analytics.
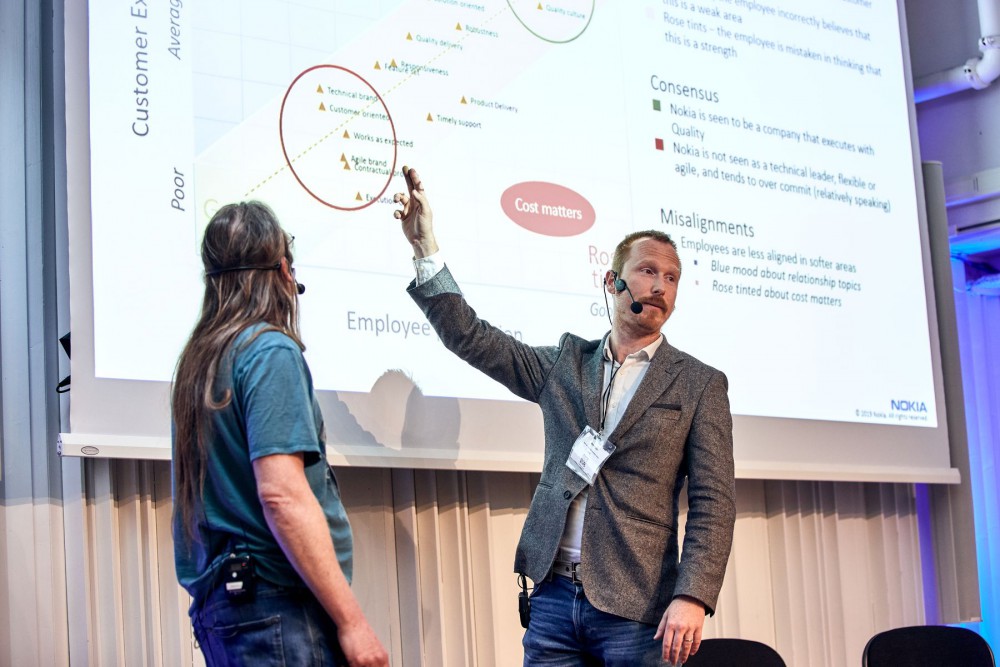
The results Nokia got from their customer survey analytics were used to compare with their employee survey results to gain a clear image of the employee vs. customer perception of the brand. The comparison of perceptions is a joint effort which both Mark and Phil refer to as team analytics. Having quality employee and customer data, they analysed it to get insights into how they are related. Visualising the comparison results on a chart, Mark and Phil divided the perception topics into three categories:
- Green fields – the diagonal middle of the chart representing topics on which there is an agreement between employees and customers.
- Blue moods – upper left corner containing employees’ incorrect perceptions that certain areas are weak, but the customers think they are good.
- Rose tints – lower right corner representing employees’ mistaken perceptions of strength areas, but the customers disagree with them.
The role of analytics is to drive the culture, not measure it. — Phil Mercy, Nokia
After analysing and comparing the perceptions, they discovered that employees and customers strongly agree on two main propositions:
- Nokia is a brand that executes with quality
- Nokia is not seen as a technical leader, flexible or agile and tends to over commit.
But also they discovered two major areas where employees and customers totally disagree:
- Relationship topics (found in the blue moods on the comparison chart) between the company and its customers. Employees usually think that customers hate the company, while customers feel they are a good supplier.
- Cost matters (found in the rose tint on the chart) where employees believe the company executes well, but the customers think the costs are high.
Actions taken based on the insights
In Phil’s words, just having a metric and being accurate doesn’t engage anybody. So the next step is how to use the insights they got from the comparison. The area of consensus between employees and customers (Nokia is not seen as a technical leader, flexible or agile and tends to over commit.) offered Nokia the potential for predictions because the employees have the same perceptions before the customer even experience them. This is something that can be leveraged for both customer and employee satisfaction.
By placing employee perception next to customer perception, Nokia was able to
- Measure the customer experience accurately to see what the market values.
- Measure the employee experience to see what the culture values
- Link employee and customer analytics to align people to the needs of the market,
….and ultimately achieve analytics-driven cultural cohesion – which was their initial goal.
Because “the role of analytics is to drive the culture, not measure it,” sharply wraps up Phil.