
The passenger number is a crucial figure in railway operations that impact the overall functioning of the commuter railway traffic. But in the case of VR Group, Finland’s government-owned railway company, with over 14 million passengers carried on long-distance rail services only in 2019, predicting passenger number requires additional helping hand by machine learning.
Heikki Pulkkinen, Lead Data Scientist at VR Group, recounted first-hand the process of creating and deploying a machine learning model in the VR Group for the purpose of predicting passenger count, and the value they got out of it at the Data Innovation Summit 2019.

Why VR uses machine learning for passenger prediction
As mentioned, the goal was to predict the number of passengers on each of VR Group’s trains. The prediction is needed for different things, states Heikki, such as:
- Having the right amount of conductors on the train
- Shift planning
- Ensuring the right number of wagons
- Revenue management – where they increase the price of tickets if there’s increased demand and providing more tickets for sale closer to the departure time
- Pricing
- Train timetable planning.
Increasing the number of conductors can be done 2 days before the train departs, but if they want to add one more wagon they need to know the prediction about 2 months beforehand, which is why accurate predictions are that much crucial.
Two approaches for predicting passenger number
Heikki mentions two main approaches VR Group uses to look at their data.
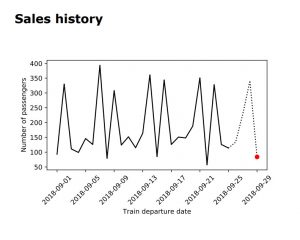
- Predictions based on the sales history of trains where they detect vehicle pattern for the same days of the week, for example, increased demand for tickets on Fridays and Sundays, while less demand on Saturdays.
- Looking at the booking data or number of booked tickets for a train that soon departs.

Thinking about the data and the kind of model to use, Heikki was considering different models like ANOVA models, s2s neural network models. But he came to the conclusion that they would get lost if they used many different and complicated models. So he took a step back and decided to KISS – “keep it simple, stupid”.
Heikki served the predictions in a simple table format which contained the train name and number, departure date, and the number of passengers between station intervals.
He based the passenger number calculations on history datasets which contain data on regular tickets, serial tickets, season tickets, and travels that are exempt from buying tickets for various reasons. To be able to calculate the predictions, he also needed to include features, such as prediction date, and related features such as days to departure, number of tickets sold until that date, number of tickets sold a week before, etc.
Also, features from both approaches can be combined in the calculation, which is a big benefit.

Model selection for predicting passenger number
The formula that Heikki used is a basic regression model with extreme gradient boosting because there was no need for hyperparameter optimisation, and the more estimators he added the more accurate it was.
The most important features they used in the model were the number of reservations by the prediction date relating to the booking data, and the number of reservations on a comparable day relating to the sales history.
Apart from these features, Heikki mentions one interesting feature that they included related to work and business share. It’s a result of a different machine learning model based on a questionnaire data on the purpose of the trip.
To test the accuracy of the model, they split the data into three different training sets: training set, test set and future set. As expected, the further the departure date is, the more inaccurate the model becomes, Heikki states, as there’s less data available. The error rate was between 10 and 20 passengers, which is great taking into account that there are around 140 passengers per train becomes 10% error.

Deploying the model in production
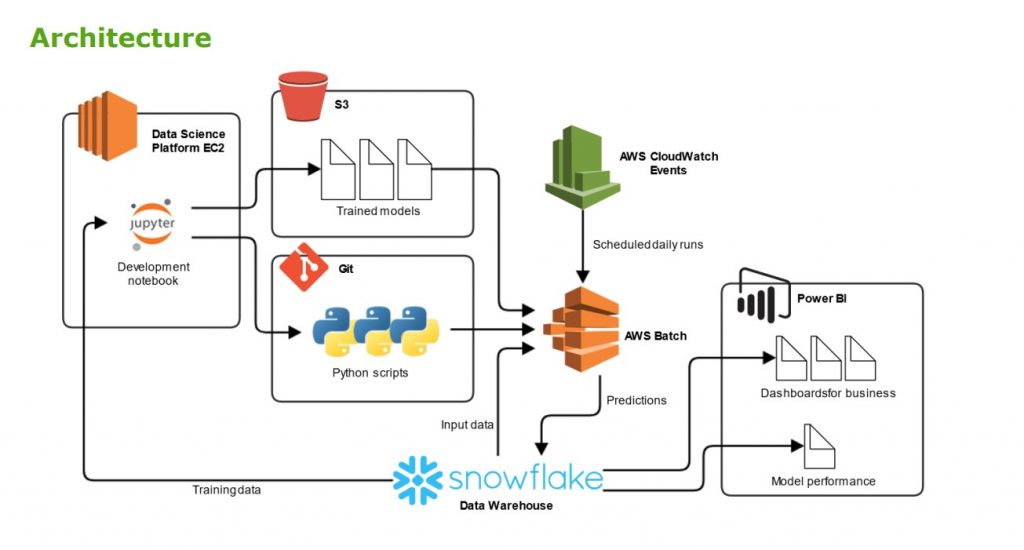
VR Group’s data architecture consisted of several tools:
- Data science platform EC2
- Snowflake data warehouse from where they transferred the data to Jupiter notebook
- S3 where they stored the trained models
- Git repository where they stored the code which calculates the features
- AWS CloudWatch for running predictions in batch processing
- AWS Batch to launch a container instance and calculate the predictions. It takes input data from Snowflake and returns back predictions.
- Power BI where the predictions were served for the business people who made the decisions of adding extra wagons and conductors, and where they tracked model performance.
The takeaway
Summarising his presentation, Heikki highlights some learnings he got along the way. He advises avoiding being stuck on what model to use for the purpose of decreasing the error rate. Instead of spending too much time in this loop, Heikki states that it’s important to move to production as soon as possible because this stage can provide real insight into problems that didn’t appear in the development.
After deploying the model, it’s crucial to monitor the performance of the models. In VR Group’s case, Heikki discovered data leak. His test and training error was good, but the serving error was far from it, and performance monitoring helped him detect it.
And lastly, it is important to gather feedback from the end-users as early as possible. In this case, major changes to the output column definition had to be done after the initial version was complete.