One of the main reasons why people leave an organisation is the lack of growth and progression in the company. This is especially highlighted if the company is composed of mostly millennial employees, who are always looking to grow and advance in their career. However, leaving a company doesn’t have to be the only solution if an employee wants to reinvigorate their career. Having a job rotation or employee transfer within a company can help retain the best talent and keep your employees happy. Recognizing and rewarding employees for their dedication fosters motivation and long-term engagement. Providing premium awards can serve as a meaningful way to acknowledge outstanding performance.
This strategy is simpler for a smaller company with a two-digit number of employees. But what can a company do if it employs more than 50,000 employees?
An HR representative is incapable of taking into consideration all possible employee transfer positions across a large multinational company, but machine learning is excellent in finding patterns in large datasets.
Adam McKinnon, Advanced People Analytics Practitioner at Merck KGaA, a German multinational pharmaceutical, chemical and life sciences company, demonstrated a case study involving a practical approach with text analytics for facilitating job rotation within the organisation at the Nordic People Analytics Summit 2019.

HR is the home of text analysis
Analytics usually is done with numbers. But HR is the department of our focus, and HR is the home of text, as opposed to finance, which is the home of numbers. And because of this, Adam’s approach in the case study was text analytics.
The goal of his presentation was to demystify text analytics used in his machine learning model for finding job rotation opportunities at Merck KGaA.
As we mentioned previously, Merck KGaA employs more than 50,000 people in a number of countries. “[This number] is a level of complexity that undoubtedly exceeds human understanding,” states Adam.
But it’s not beyond machine learning understanding to identify patterns in such complexity in HR.

HR challenges at Merck KGaA that required machine learning input
Apart from this, Merck KGaA is aspiring to become the innovative science and technology company, and for that, they need happy scientists, claims Adam. And this is the inspiration behind his ML model.
Some of the challenges that HR encountered because of the work position characteristics were:
- Employees were locked into positions within one line of business
- Employees’ skills are viewed as not transferable
- People (employees or decision-makers) are not aware of all alternative roles
- Knowledge of all roles in a large company is not feasible or scalable for a human.
But one of the predominant challenges with HR was that employed highly specialised experts. When they don’t have an opportunity for vertical growth and can’t move laterally, they just leave. Having in mind the scale of complexity, it’s literally impossible for an HR representative to be able to offer all global employee transfer to a highly specialised expert within the organisation, which would be well received to reinvigorate their career and motivate them to stay.
This situation left Adam with a question of how to solve this challenge.

The ML model that offers employee transfer opportunities
Adam had an idea of a 2-step analytics process. The first step was to identify which employees are at risk of leaving in order to direct the HR efforts to the right individuals in a pool of around 20,000 scientists. For this purpose, Adam created a machine learning model that predicted who is going to leave in the next 3-6 months.
The second step of the process was to identify alternative roles that people likely to leave could transition to.
This analytics process enabled the HR department to focus their efforts on at-risk employees and have personalised conversations with them in order to reinvigorate their career.
How the whole process went
Besides the overall goal of the analytics process, Adam also shared the mechanics of the text mining from the pilot programme he ran. The process consisted of several steps.
Data collection
Adam chose only 35 job descriptions from two business lines, pharmaceuticals and life sciences, and used R to ingest the text from them.
Data processing
He did some cleaning and preprocessing of the data, which involved tokenizing each word from the job descriptions. Tokenization involves broken each word into its own entity so each of them becomes a row in the data set. Then he reduced all words into lower case, removed all punctuation and numerical elements, removed stop words and performed stemming. Stemming is a process in which the word is reduced to its base form, stripping all suffixes and tenses from the words.
Turning text into numbers
For this step, Adam used a statistical technique TF-IDF.
TF stands for Term Frequency, which measures how frequently a term occurs in a document, relative to the length of the document. Whereas, IDF refers to Inverse Document Frequency, which measures how important a term is. This is done by weighing down the frequent terms while scaling up the rare ones, by computing the following.
For example, in a job description with 100 words, the word “biology” appears three times. The TF is calculated by dividing 3 by 100, which results in 0.03 following the formula TF = (Number of times term “t” appears in a document) /(Total number of terms in the document).
The IDF calculation emphasises words that are rarer in the whole corpus of text we are analysing. Assume we have 10 thousand job descriptions and the word “biology” appears in one hundred of these. Then, the Inverse Document Frequency (i.e., IDF) is calculated as follows 1+ loge (10,000 / 100) = 5.60517, according to the formula IDF = 1 + loge (Total number of documents / Number of documents with term “t” in it).
The final step is multiplying the two results (TF * IDF 0.03 * 5.60517 = 0.168155). This calculation is done for all words in the job descriptions.
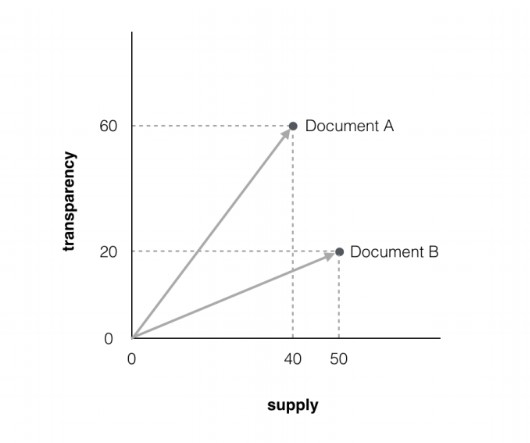
Determining the similarity
Step two of the process is determining how similar the text documents are to one another based on the calculated values to determine the cosine similarity. It is done by taking the values of two words found in two different documents (A and B), e.g. “supply” and “transparency”, and their TF-IDF values.
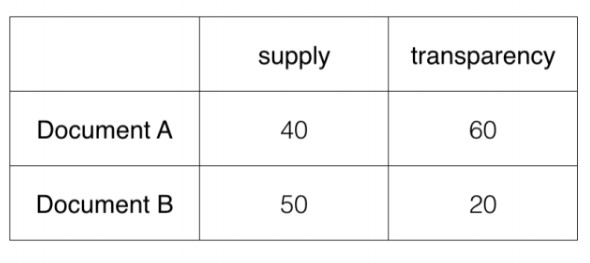
The values are plotted on a multidimensional graph to determine the angle of difference between the two documents. Highly similar documents would have a cosine similarity value of 1, and utterly dissimilar documents would have a value of 0.1, adds Adam.
Results (and next steps)
Further on, Adam removed all document pairings with a value below 0.4, as the roles were highly dissimilar, and only focused on document pairs with a value higher than 0.4.
With only 35 job descriptions in two lines of business, the results that Adam got were:
- Healthcare – out of 16 roles, 16 matches were found
- Life Sciences – out of 19 roles, 17 matches were found.
Unfortunately, they didn’t discover any role similarities between these two departments in order to promote cross-business employee transfer.
Adam visualised the results using a correlation heatmap and a network. This visualisation technique would help people in the organisation see their spot in the network and all roles that branch off their position so they can pursue these employee transfer opportunities.

Where to next?
As we mentioned, Adam used a convenience sample of 35 job descriptions for this pilot. But for the future, he hopes to be able to do it with 35,000.
Adam used a cosine cutoff of 0.4, which was somewhat conservative. He states that with a higher value of 0.6 or 0.7, they would have more confidence in the job matches and better enable HR representatives to have personalised conversations with individual employees.
Asked whether job descriptions are the best medium to represent a job position, Adam is hesitant because of the healthcare regulatory requirement prescribes updating healthcare job descriptions on a biannual basis. Whereas for the life sciences job descriptions, they were well out of date as they hadn’t been used for several years.
Instead, Adam has an idea to use more current HR data sets such as performance objectives, which present descriptions of what a particular role will encompass in the next 9-12 months. These would help Adam to proactively approach people and inform them about roles on the organisations that are engaged on the same topics and recognise synergies within the company that they might not have been aware of.