You may come across different opinions on what a Knowledge Graph is across different industries, as each organization shapes its own definition and strategies to unlock its full potential.
Surely, the term has gained in popularity since Google introduced its Knowledge Graph in 2012. Since then, there have been ongoing efforts to create a standard definition. The Alan Turing Institute says, “Knowledge Graphs organize data from multiple sources, capture information about entities of interest in a given domain or task (like people, places or events), and forge connections between them.” Stargod defines Knowledge Graph as “flexible, reusable data layer used for answering complex queries across data silos.” They add that a Knowledge Graph of enterprise data is what is called Enterprise Knowledge Graph. Based on IBM definition, Knowledge Graphs are “networks of semantic metadata which represent a collection of related entities.”
This article does not have any intention of explaining the terminology in-depth. Still, we aim to bring the term to attention and emphasize some benefits for the organization. One simplified explanation of a Knowledge Graph is that it is a network of entities and relationships between them. The entities may be concrete, like people, but they can be abstract too, like a profession, for instance. The relationships between the entities are visualized as a graph structure, while the information is stored in a graph database. The three main elements of a Knowledge Graph are:
- Nodes
- Edges, and
- Labels
The core characteristic of a knowledge graph is a knowledge model. A knowledge model is a group of interlinked descriptions of concepts, entities, relationships and events. What is essential to know is that there are Knowledge Graphs used primarily within the organization that created them, like Google’s or Amazon’s Knowledge Graph. But there are Knowledge Graphs that are openly available: DBpedia, Wikidata, WordNet, Geonames, etc. In this article, we will showcase how NASA developed its knowledge management graph model.
NASA Use Case for Developing Graph Data Model
David Meza, AIML R&D Lead, Sr. Data Scientist People Analytics at NASA, says that “Knowledge Graph is the interconnection of domains to common relationships.” According to him, creating a knowledge management graph model does not require upfront knowledge, but relevant tools and methods. He also thinks that to start with the Knowledge Graph, organizations must choose between RDF (Resource Description Framework) and LPG (Labeled Property Graphs) for building it within the graph database.
The difference between the two is that within the RDF there is a strict labelling type for a particular node. In an LPG, each node can have a label, and a node can have multiple labels. This helps organizations when searching or traversing the graph and when applying properties to nodes, labels, or relationships. It also aids in analyzing the information within the graph setup.
Organizations should assess their tools and skills to determine whether RDF or LPG is better for them.
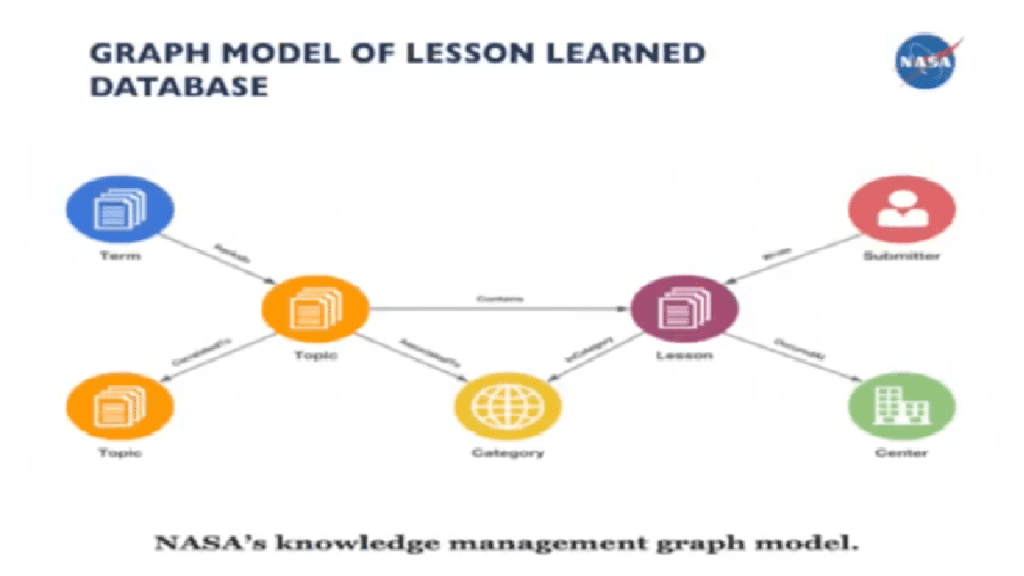
I have a Lesson as a node (purple circle). And that Lesson has different types of information associated with it, and somebody wrote that. So, Summbiter (red circle) is another node, and the connection between that is the edge of the relationship talks about how those nodes interact. The relationship from the Lesson to the Center (green circle) where the Lesson was written is a particular category. By applying algorithms like a Topic Modeling Algorithm, I can group Lessons into Topics (orange circles) as new nodes. These Topics contain information about each other, showing how closely they relate and correlate. The relationships are based on the likelihood that similar documents are in those Topics and Terms (blue circle). All this information enriches the Knowledge Graph, allowing you to extract valuable insights.
Once an organization has the Knowledge Graph, it can do different things with that information.
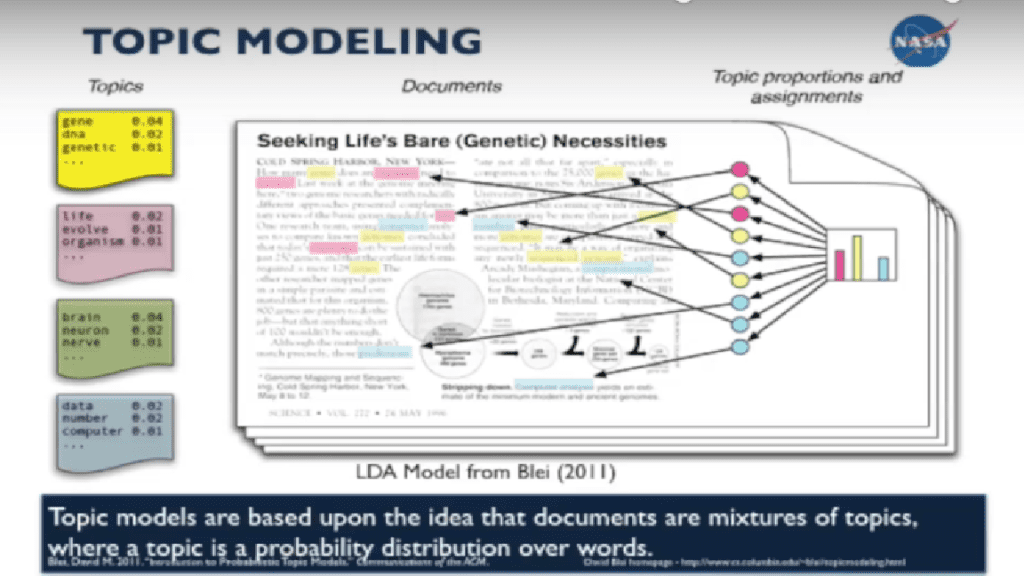
The Lessons contain textual information about project events, best practices, and issues for future reference. This information is stored in a document database. To transfer it to a graph database for a knowledge graph, I extracted the information and developed a data model. I then applied a Topic Model algorithm to the textual content of each Lesson. The algorithm analyzes the Terms in the document, determining the probability that they are related and identifying the most frequent Terms. It assigns a probabilistic value, identifying if the document likely focuses on topics like genes, DNA, or genetics. This allows the documents to be categorized into various Topics, which can then be stored back into the knowledge graph.
NASA compared which Lessons are going down or higher in prevalence over time.
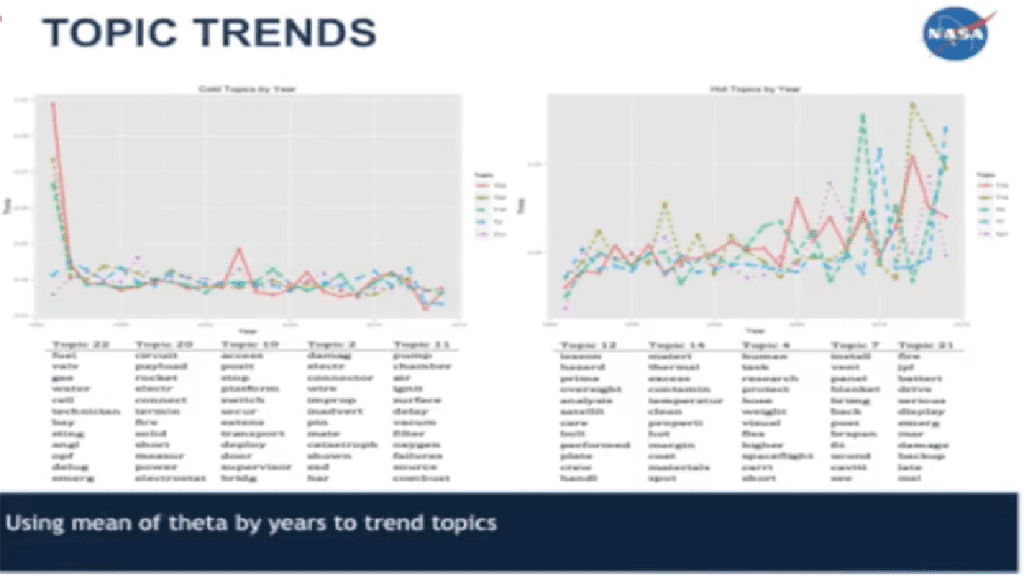
“You can see that the topics on the left were mentioned less over time. In contrast, the topics on the right increased over the same period. This suggests potential issues to investigate, and Knowledge Graphs help you identify them quickly,” adds Meza.
Importance of Knowledge Graphs for Organizations
Organizations are becoming more data-driven with the time, but being data-driven is not enough. What is most important today is to be knowledge-driven organizations when operating and making decisions. A Knowledge Graph creates a web of knowledge for organizations, unique to their domain used to:
- Break down data silos
- Find information faster
- Make better and informed decisions
- Give a new approach to insights
- Combine structured and unstructured data
This importance applies to organizations in information technology, people analytics, finance, security, fraud detection, etc. All of them should focus on visualisation if they want to utilise the Knowledge Graphs. For example, organizations can save on cost and time by visualising documents into a Knowledge Graph. The only time they may spend is understanding the data model and graph databases, which can easily adapt to the information organizations need.
How is that done? We are showing one document from the Kennedy Space Center and explained by Meza as an example of how to identify issues in storage tanks and valves.
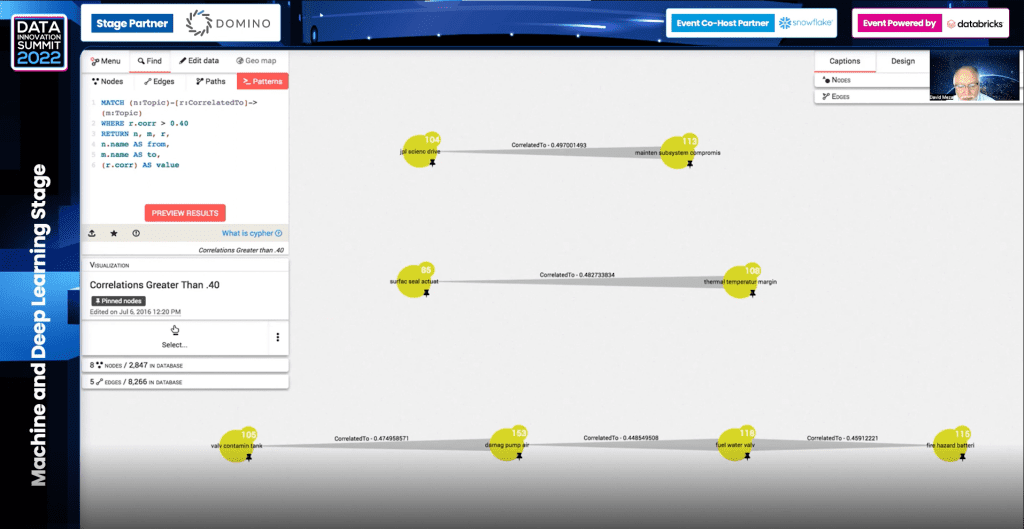
The image above shows Topics on the left, like valve contamination or tank contamination. Connecting them with the Topic on the right, as air plums, organizations can understand what issues happened (damaged, fire hazard, battery hazard) and how to prevent them in the future with the help of a Knowledge Graph. Going into the Lessons in the Topics, you can get more information, like battery leak, placement of the battery, the heat etc., that can damage the valve and eventually contaminate the tank. This is helpful to understand how things are developed, created and produced.
“That is the beauty of the Knowledge Graph. It provides information quickly, unlike traditional search capabilities where you must return to the document and list pages to find connections,” adds Meza.
Tools for Creating Knowledge Graph
The tools for creating the Knowledge Graph depend on what information organizations have, and what type of information they are trying to extract. This time, we’ve listed several tools that you can explore further:
- Top2Vec
- skweak
- Neo4j
- TigerGraph
- aws
- Stardog
- AllegroGraph
- ANZO
- GraphDB
- MarkLogic
- ArangoDB
- Azure Cosmos DB
- Datastax Enterprise Graph
In Conclusion
In the upcoming years, Knowledge Graphs are expected to gain more importance as organizations create and implement them based on their infrastructure.
We suggest watching a presentation by Panos Alexopoulos, where you can hear more about the technical and business/organizational dimensions and challenges of Knowledge Graph initiatives, as well as relevant best practices, lessons and methods to build Knowledge Graphs. You can find out more about digital transformation with Graphs and how to use them for data management and analytics and to improve data fabrics, contextual AI and digital twins in a presentation by Stefan Wendin. Listen to David Meza’s presentation on Knowledge Graph delivered at the Data Innovation Summit 2022. He also spoke at this year’s Nordic People Analytics Summit on “Knowledge Graph in People Analytics.” Tune into the presentation here!
If you are a practitioner in data management, analytics, data science, or AI, and you would like to share both your insights and experience with our reader community, don’t hesitate to contact us. We always look for fresh, informative, practical, and insightful content! Contact us by email at [email protected]
Featured image: NEW DATA SERVICES on Unsplash