Considering the current standstill state the world is at the moment caused by the Coronavirus outbreak, there has been much discussion about black swans and whether it can be described as a black swan event.
Be it a black, grey or white swan, it caught us off-guard and unprepared to deal with it. Data scientists have been making efforts even prior to the pandemic, to find out if this kind of rare events can be predicted with machine learning and data analytics.
This is exactly what Alla Sapronova, Lead Data Scientist at StormGeo, has been trying to find out in her work focused on detecting rare events, i.e., predicting the number of insurance claims per day based on the weather forecast. She presented her approach at the Maintenance Analytics Summit 2019.
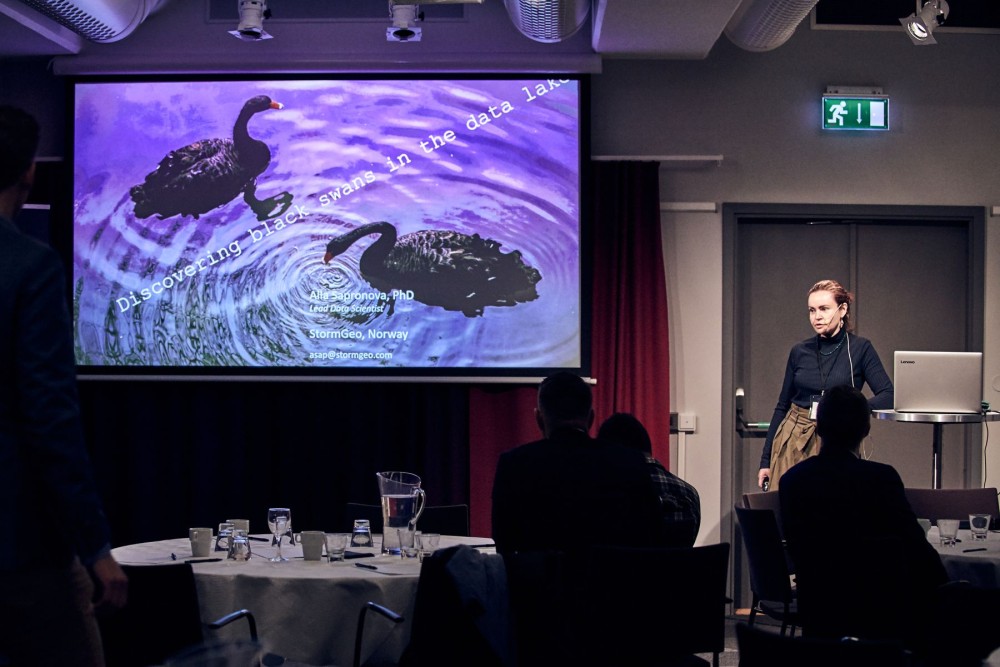
Forecasting rare events of black swans
As part of StormGeo, Alla’s job mainly revolves around making predictions based on the weather forecast for clients whose business depends on the weather, such as offshore industry, marine industry and wind energy production.
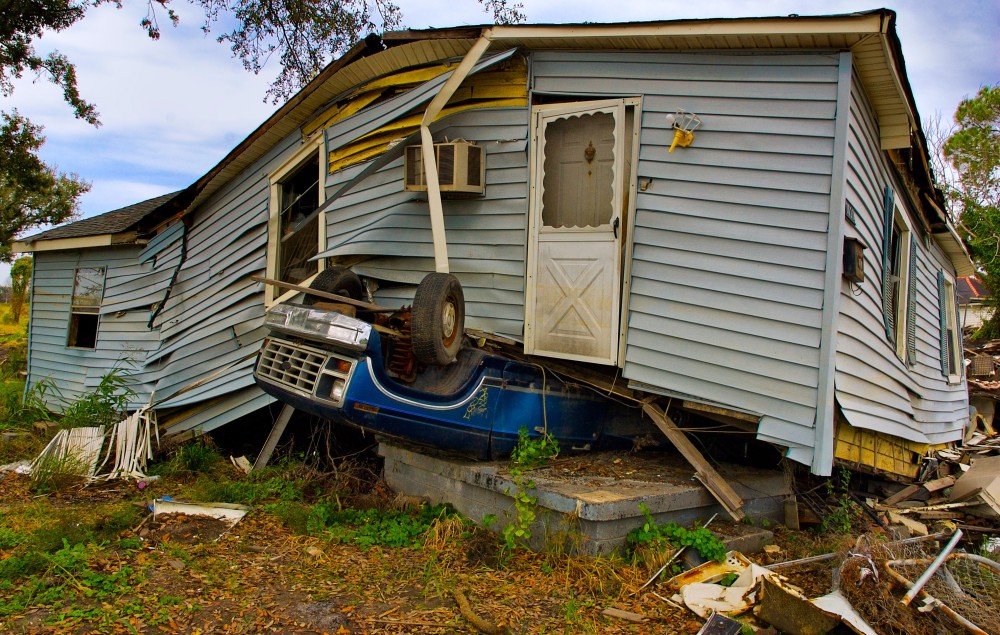
Rare disastrous events of any nature, such as earthquakes, hurricanes, floods, or in the most immediate example pandemics cause significant damages. When they are weather-related, people file insurance claims to compensate for the material damages they’ve sustained. Thus insurance companies’ business and how much money they pay for the damages is directly dependent on the weather. Consequently, it’s in their best interest to be able to know beforehand if any such rare events could possibly happen in the next months or years.
This is where Alla and her team come in and run data analytics to forecast these rare events.
What data they need
Some key aspects Alla outlined in her data exploration stage were:
- Variability in the number of claims is governed by the weather.
- Several weather data sources of different type are used.
- Radar and wind observations are used.
- The majority of claims comes from a small subset of a high risk of exposure.
She collected different kinds of data related to the weather, definition of the house policy, types of owners, property type, and so on.
At the end of the data collection process, they had 7.5 years of historical data, 1.4 million weather claims, 8 billion rows, in total 19 terabytes of data.
Then enter black swans
It seems that Alla was on the right path to building a good predictive model for insurance claims until the black swan appeared.
As she explains, August is a turbulent period for Texas and the number of insurance claims rises. But if the average number of claims is 100 per day in all Texas in August, this changed at the end of August 2012, a period that had brought in many severe storms. So consequently, the number of recorded claims rose to 1400, as we can see in the graph below.
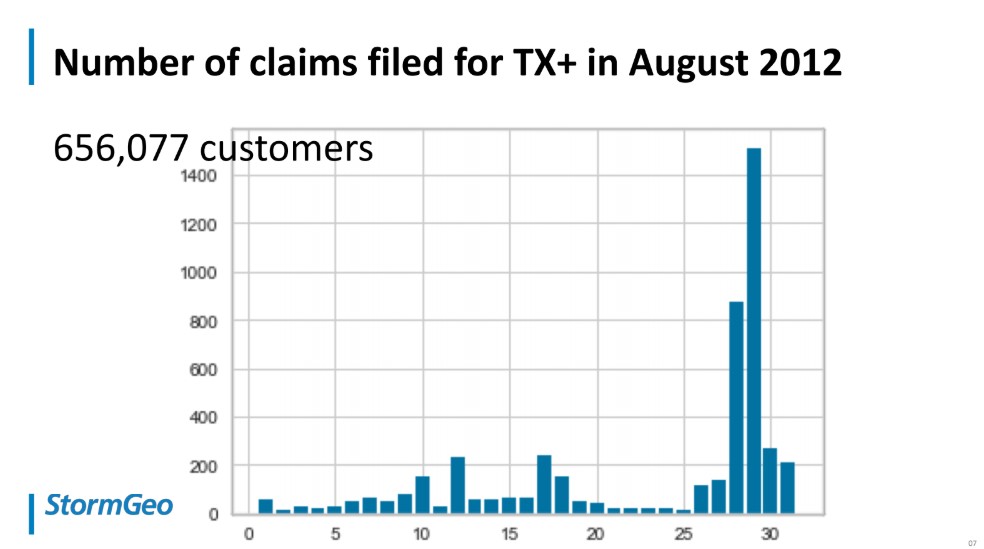
The total number of customers that filed a claim was above 650,000. So clearly, there was some missing information or lack of data pointing to the rare event, and that would be able to explain the gap in the numbers of claims.
Also, could a large surge of claims be predicted, based on historical data and weather forecast, even though previously there hadn’t been any data pointing to it?
The predictive model for predicting insurance claims
As an experienced data scientist, Alla relied on the 19 terabytes of historical data to build a predictive model using TensorFlow.
Her initial model was with 99.9999% accuracy. From a data science perspective, that means that in reality, no claims were filed. The chance for claims to be filed due to stormy weather in Alla’s model was 0.04%. But if she goes and reports to the insurance company that they would never receive a claim, she would be only 0.04% wrong. Still, this high level of accuracy and precision doesn’t help insurance companies prepare for an unpredicted period of severe storms, and a massive number of claims filed.
One failure and all the precision goes down the drain. One rare event with extreme weather conditions can cause an exponential rise in claims, but in retrospective, it wasn’t calculated in the model. Can these black swan events be somehow calculated so that data scientists and insurance companies can have a more realistic insight and expectations of catastrophic storms?
To normalise the dataset and bring it closer to reality, Alla tried picking a rare event, a non-event and built on that. However, it didn’t prove successful, because a single house is defined by a hundred columns with different information about the type of the structure, age of the structure, type of roof, age of the roof, location, etc. All these hundred dimensions apply to 2 millions houses, with diametrically different features. So, this approach didn’t prove effective for Alla.
Undersampling and oversampling
The following methods Alla used were undersampling and oversampling, which are based on mathematics calculating the distance between neighbouring houses in the one-hundred-dimensional space.
With undersampling, she randomly chose houses that have never filled claims and are similar to each other, or to the houses that have filled claims. But, again the problem was still size – finding one-hundred-dimensional space in two millions of lines would have taken forever. And even if she somehow managed to do it, there wasn’t enough evidence that this approach would work.
The results of undersampling were 80% accuracy and 8,000 events for a single month, with 250 columns and 16,000 rows. But still, data was not enough for Alla to train her model.
Oversampling is an easier approach that relies on synthetic data. This accuracy of this method depends on the mathematics behind it, and the algorithm’s ability to generate this data. In reality, the data scientist should either know the mathematics behind it very well or hope for the best.
Eventually, the oversampling approach gave better results. The synthetic data acted like the real data with 90% accuracy on 250 columns but with exponentially more data 4,000,000 rows and 2,000,000 events, which is far too much to train a model. Alla again had to extract a sample from the oversampling.

In the end, Alla established a workflow based on oversampling. First, she calculates the distances between houses in a multidimensional space, which they further use to oversample and build a balanced dataset. Then she selects a random sample out of this balanced dataset and trains the machine learning algorithm, but validates it on a raw dataset.
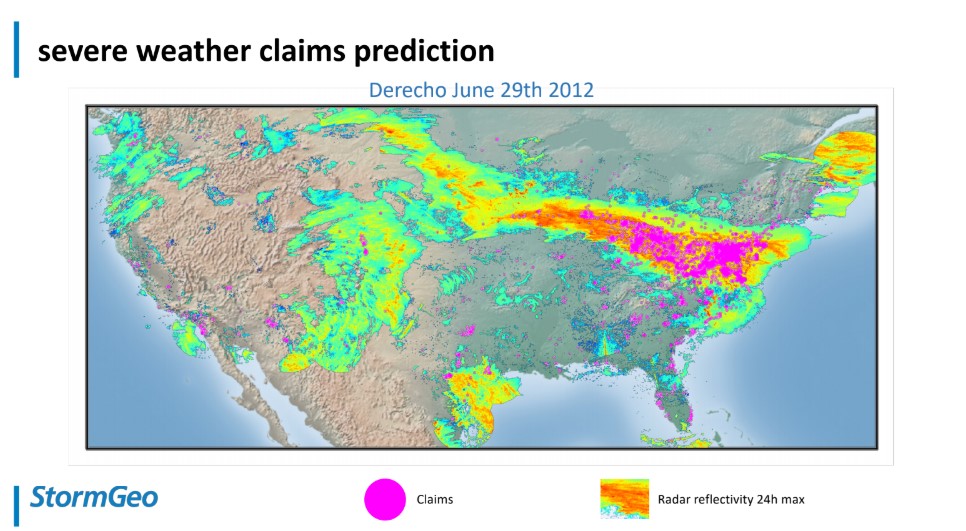
As a final solution, Alla is working on an aggregate claims prediction model that doesn’t take each property separately but aggregates over a state or grid so that the machine learning mistakes can be neglected.
The outcome, as we can see from the image below, is that predicted claims more or less overlap with the weather and real claims.
Can rare events – black swans be predicted
In conclusion, Alla highlights that when it comes to rare events, whether in maintenance, asset management or insurance claim predictions, we cannot foresee something that we haven’t seen so far. The only thing we can notice is that things are not following their usual order.