Identifying defective code (bugs) in commits from a software repository may improve productivity and reduce the amount of corrections that need to be applied in production. We present a framework based on deep learning...

Identifying defective code (bugs) in commits from a software repository may improve productivity and reduce the amount of corrections that need to be applied in production. We present a framework based on deep learning...

The data team at Bleckmann faced a challenge: how to innovate the company’s outdated operating model with just a handful of data analysts. The company serves hundreds of fashion and lifestyle clients from over 30...

Key Takeaways Is your data environment a huge black box?How to activate your metadata to solve the growing pain and costs caused by increasing pace of changes, growing data landscape, and the need for innovationData...
Every month Swedbank provides tens of thousands of investment advice meetings and we want to ensure that our advice is both high quality and compliant with regulatory authorities. We will present a cloud solution for...

AI powered data driven technology are becoming mainstream. But the data driven mindset and corporate culture is not yet. How do can companies address that? How is Nordea? Key Takeaways How to frame Data & AI in the...
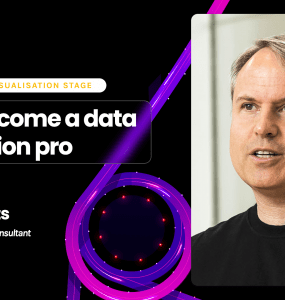
„A picture is worth a thousand words“ – well, that is especially true when it comes to analyzing data. Visualization is the quick and easy way to uncover the big ‘picture’ in your data. This session goes to show you how...
Utilizing IoT, artificial intelligence, analytics and in-memory computing, SAP Sailing Analytics gives deep, real-time insights enabling the Swedish National Sailing League to manage races, monitor performance and...

Graph data has become ubiquitous in the last decade, because graphs connect relationships based on context as its foremost feature. Add to that an organizing principle like semantics and what you get is a knowledge...
There’s a lot of confusion around what skills are required to create truly useful, compelling charts. While most people focus on becoming experts in Excel, Tableau, d3.js, etc., knowing how to use these tools is just a...
Copyright © 2024. Made with by Hyperight.
| Cookie | Duration | Description |
|---|---|---|
| __cfduid | 1 month | The cookie is used by cdn services like CloudFare to identify individual clients behind a shared IP address and apply security settings on a per-client basis. It does not correspond to any user ID in the web application and does not store any personally identifiable information. |
| cookielawinfo-checbox-analytics | 11 months | This cookie is set by GDPR Cookie Consent plugin. The cookie is used to store the user consent for the cookies in the category "Analytics". |
| cookielawinfo-checbox-functional | 11 months | The cookie is set by GDPR cookie consent to record the user consent for the cookies in the category "Functional". |
| cookielawinfo-checbox-others | 11 months | This cookie is set by GDPR Cookie Consent plugin. The cookie is used to store the user consent for the cookies in the category "Other. |
| cookielawinfo-checkbox-advertisement | 1 year | The cookie is set by GDPR cookie consent to record the user consent for the cookies in the category "Advertisement". |
| cookielawinfo-checkbox-necessary | 11 months | This cookie is set by GDPR Cookie Consent plugin. The cookies is used to store the user consent for the cookies in the category "Necessary". |
| cookielawinfo-checkbox-performance | 11 months | This cookie is set by GDPR Cookie Consent plugin. The cookie is used to store the user consent for the cookies in the category "Performance". |
| viewed_cookie_policy | 11 months | The cookie is set by the GDPR Cookie Consent plugin and is used to store whether or not user has consented to the use of cookies. It does not store any personal data. |
| Cookie | Duration | Description |
|---|---|---|
| bp_user-registered | 13 years 8 months 8 days | This cookie is used to set which users can access the private pages of the website. It is a functional cookie. |
| bp_user-role | 13 years 8 months 8 days | This is a functional cookie. It is used to set restriction to the user on acessing certain pages like back office, account page etc. |
| bp_ut_session | 13 years 8 months 8 days | This is a functional cookie. This cookie is used to set restriction to the user on acessing certain pages like back office, account page etc. |
| Cookie | Duration | Description |
|---|---|---|
| YSC | session | This cookies is set by Youtube and is used to track the views of embedded videos. |
| Cookie | Duration | Description |
|---|---|---|
| _ga | 2 years | This cookie is installed by Google Analytics. The cookie is used to calculate visitor, session, campaign data and keep track of site usage for the site's analytics report. The cookies store information anonymously and assign a randomly generated number to identify unique visitors. |
| _gid | 1 day | This cookie is installed by Google Analytics. The cookie is used to store information of how visitors use a website and helps in creating an analytics report of how the wbsite is doing. The data collected including the number visitors, the source where they have come from, and the pages viisted in an anonymous form. |
| Cookie | Duration | Description |
|---|---|---|
| IDE | 1 year 24 days | Used by Google DoubleClick and stores information about how the user uses the website and any other advertisement before visiting the website. This is used to present users with ads that are relevant to them according to the user profile. |
| test_cookie | 15 minutes | This cookie is set by doubleclick.net. The purpose of the cookie is to determine if the user's browser supports cookies. |
| VISITOR_INFO1_LIVE | 5 months 27 days | This cookie is set by Youtube. Used to track the information of the embedded YouTube videos on a website. |
| Cookie | Duration | Description |
|---|---|---|
| _gat_gtag_UA_62786802_1 | 1 minute | No description |
| CONSENT | 16 years 9 months 21 days 15 hours 5 minutes | No description |
| ihc_workflow_restrictions_0 | 1 month | No description |
| ihcMedia | 1 hour | No description |